
You are reading the documentation for 1.0.3. The current version is 1.0.6.Go to 1.0.6
Reports and dashboard
The dashboard
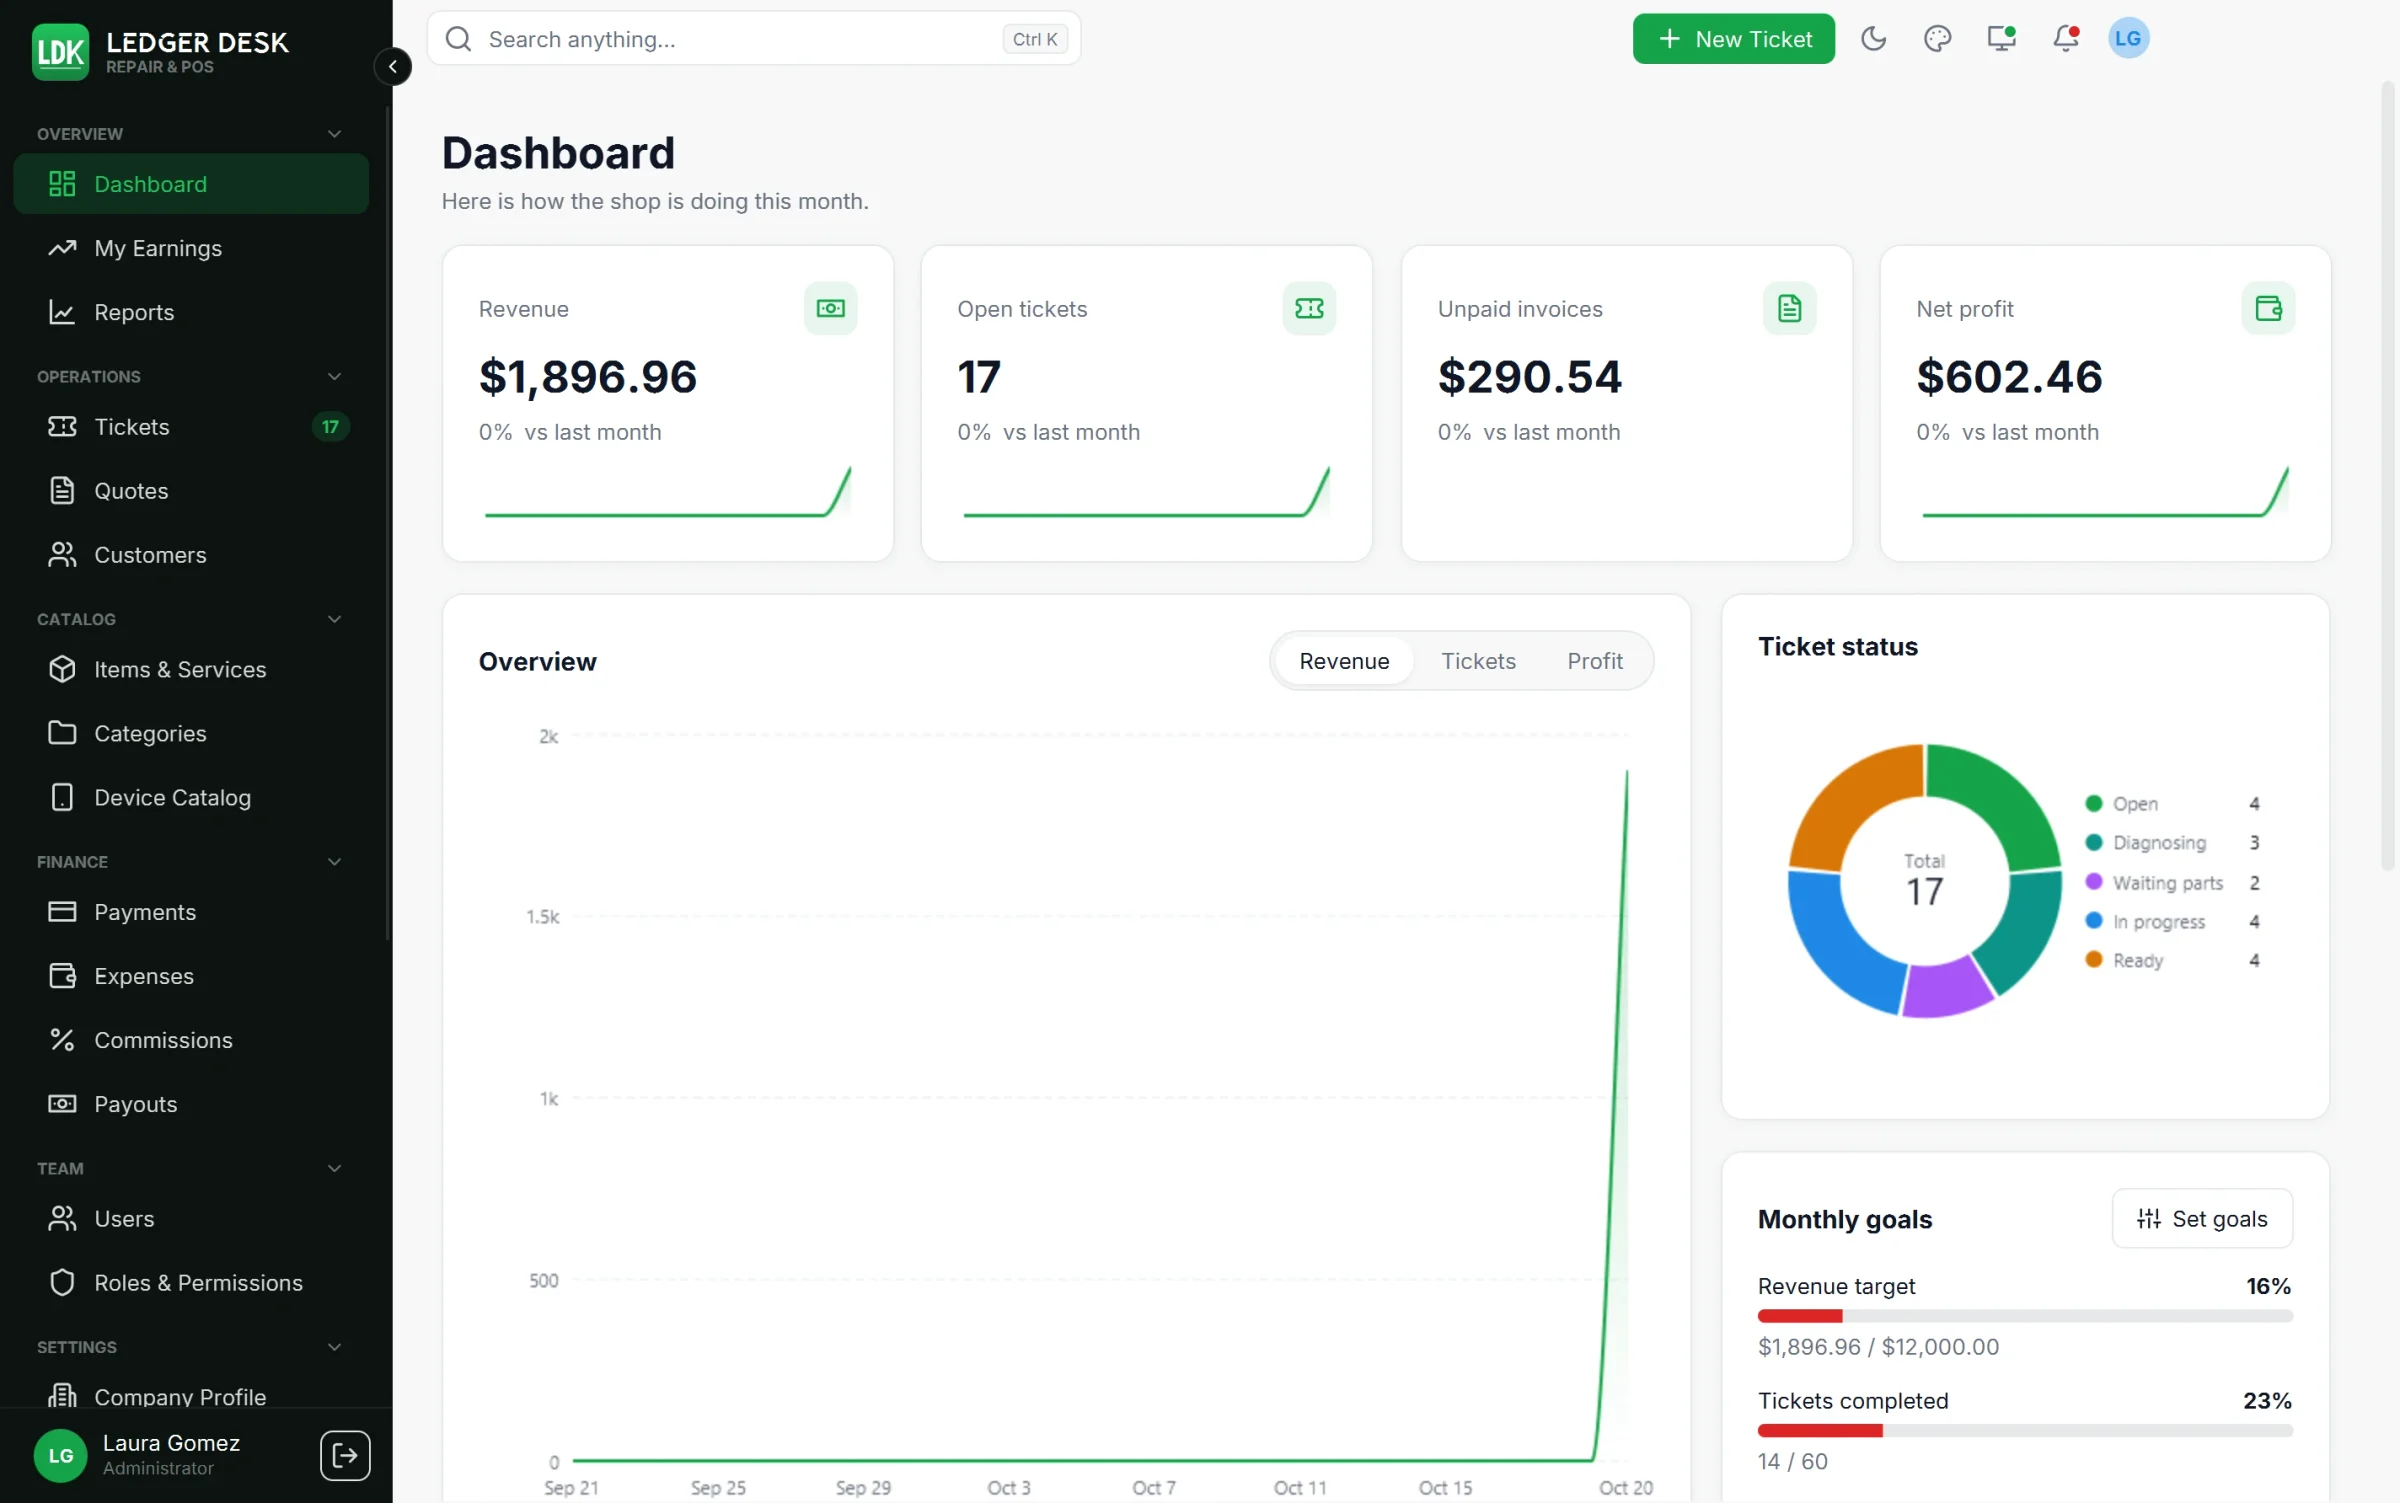
Overview → Dashboard is the first page after sign-in (unless you chose another start page in Preferences).
- Four cards: Revenue (this month), Open tickets, Unpaid invoices and Net profit, each compared with last month and with a small trend line.
- Overview: a chart of the month with the tabs Revenue, Tickets and Profit, and below it the Total, Average, Best day and Growth.
- Ticket status: a ring of the open tickets by status, with the total in the middle.
- Monthly goals: revenue, tickets finished and average ticket value against their targets. Press Set goals to type your own targets (needs Edit the company profile); without a goal the target is last month.
- Recent tickets and Recent activity (tickets created and ready, bills issued, payments, approvals…).
People who may see only their own numbers get a dashboard of their own work: their lines, their commission (the fourth card is My commission) and their tickets. The unpaid invoices card is hidden for people who may not see invoices. The dashboard follows what other people do within a few seconds.
Reports
Overview → Reports lists the reports you may open. Every edition has the Sales summary and the Daily summary; Standard and Premium add the others, and the exports and printing.
| Report | What it shows | Edition |
|---|---|---|
| Sales summary | Revenue, tax collected, discounts, refunds and net, by day, week or month | All editions |
| Daily summary | The figures of one day; also emailed every evening | All editions |
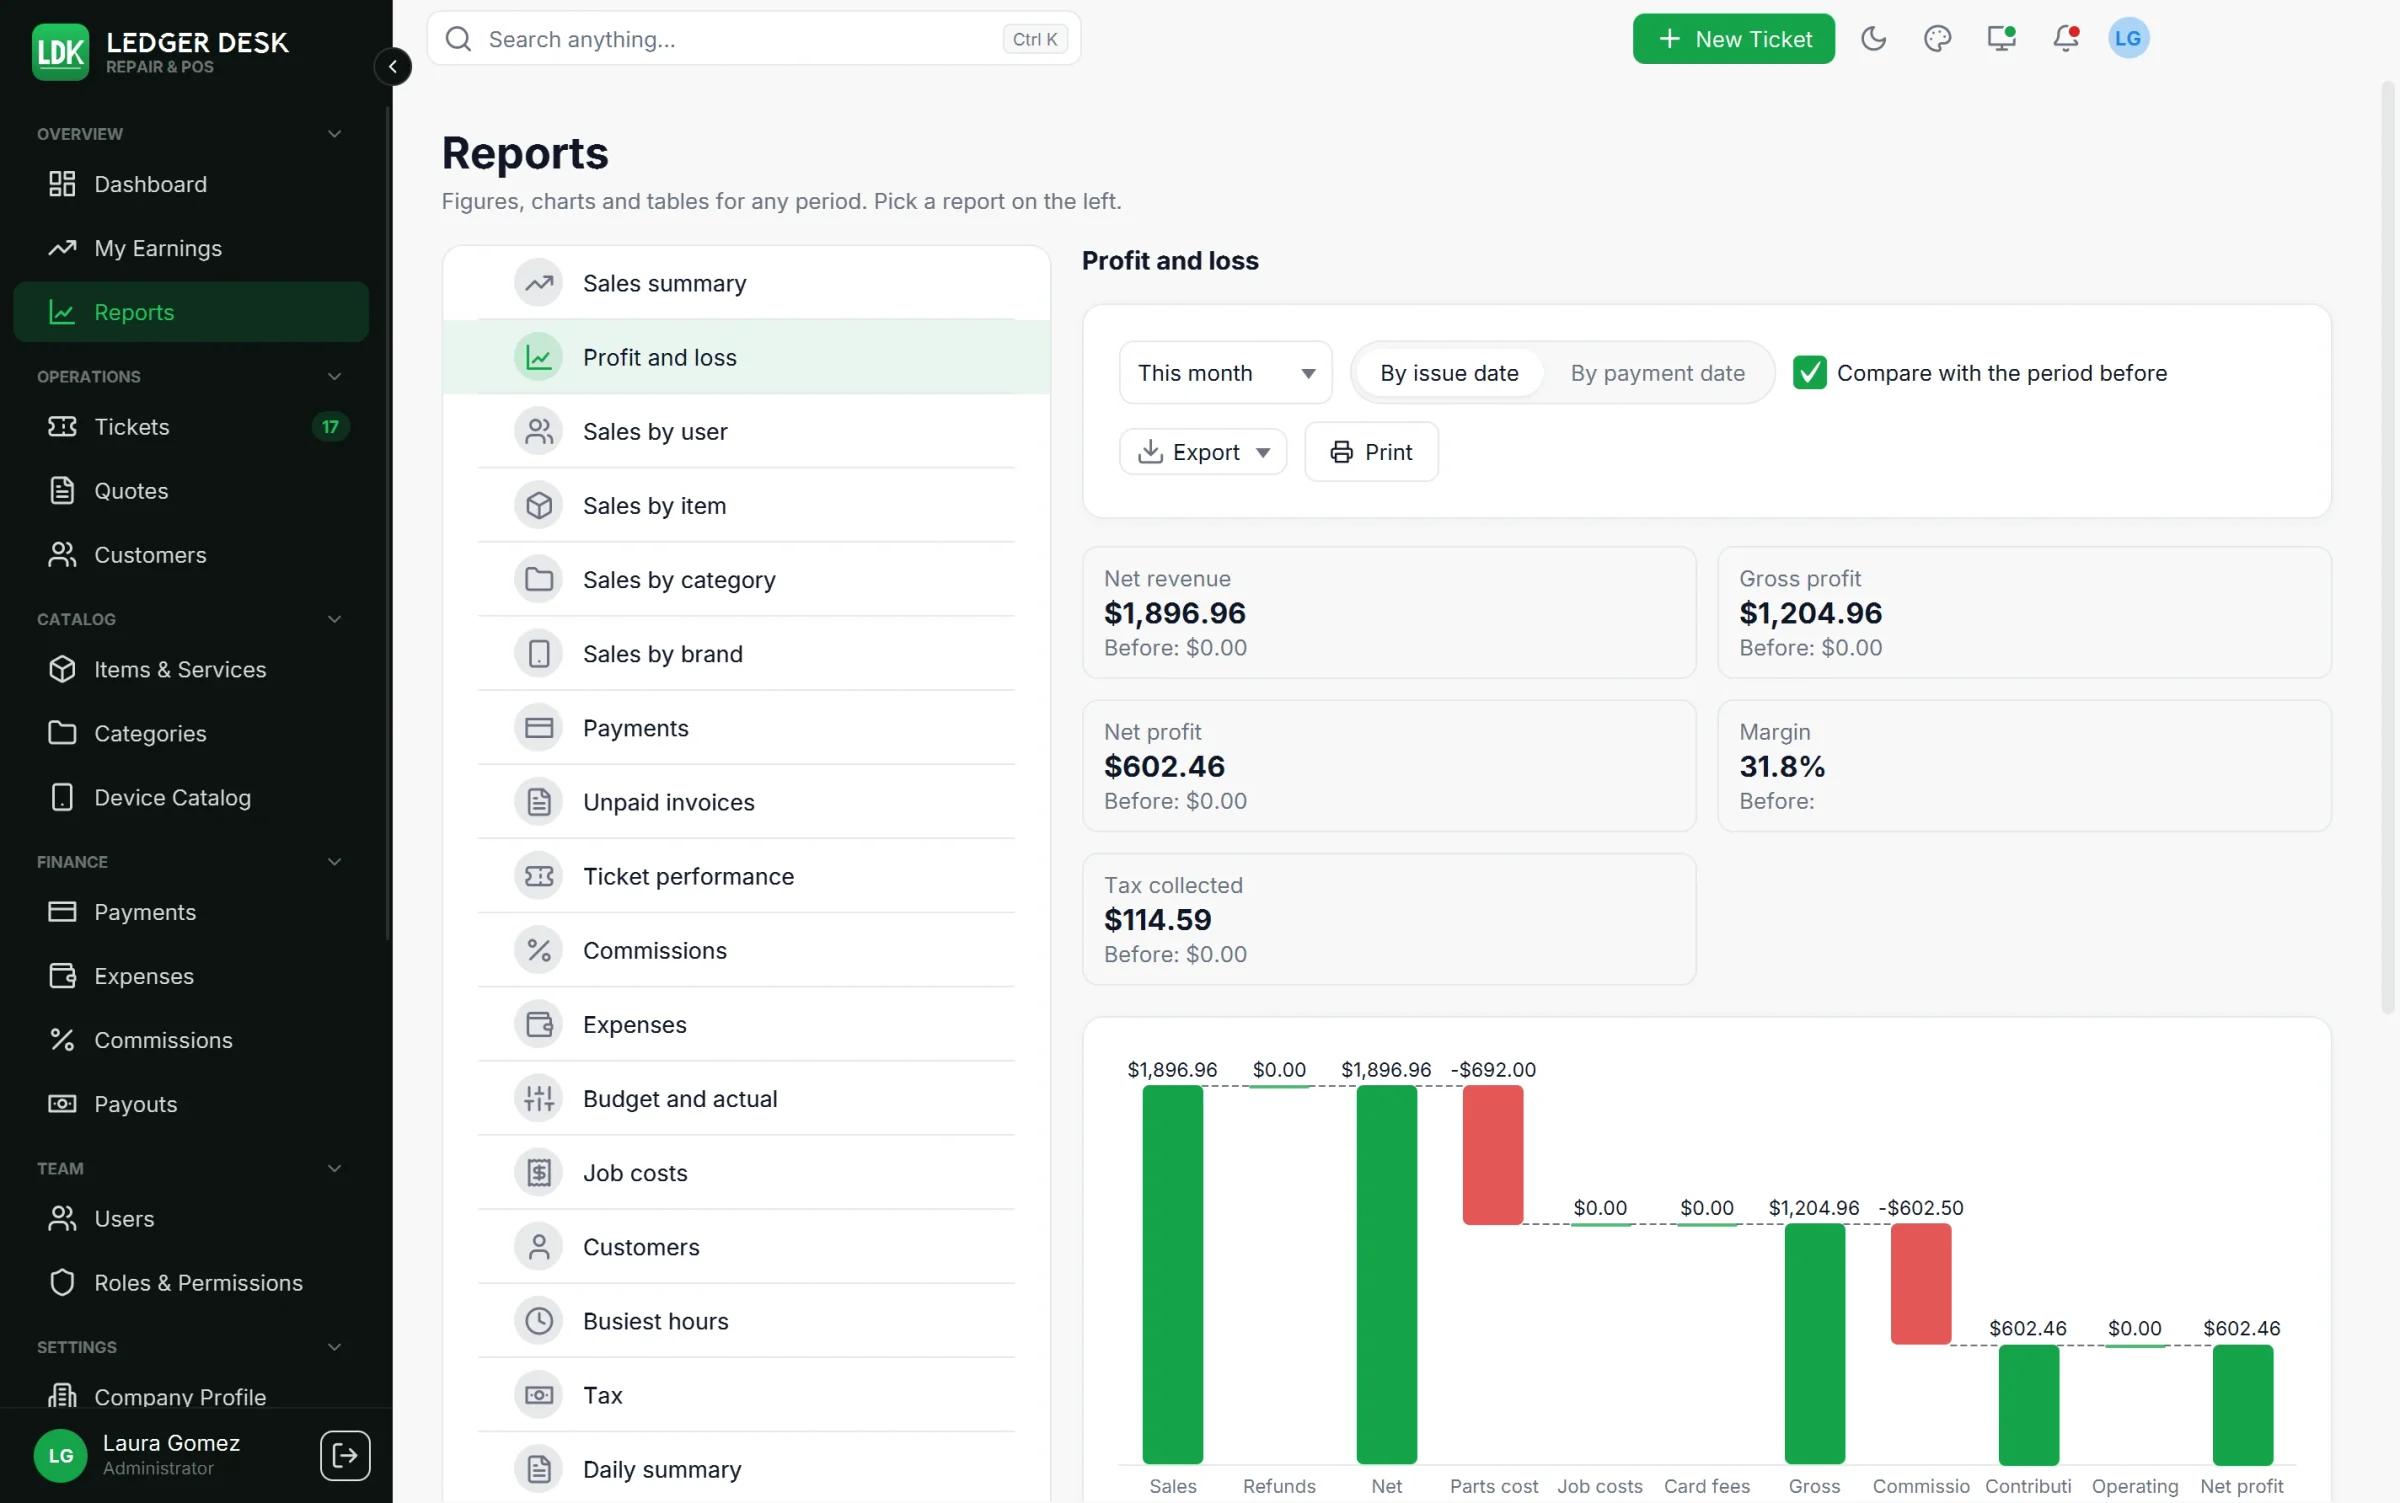
| Profit and loss | The full money picture as a bridge chart, accrual or cash basis | Standard |
| Sales by user | Bills, revenue, profit, commission and average sale per person | Standard |
| Sales by item | Quantity, revenue, profit and margin per item; top and bottom | Standard |
| Sales by category | The same per catalog category | Standard |
| Sales by brand | The same per brand | Standard |
| Payments | By method and by day: the end-of-day cash-up | Standard |
| Unpaid invoices | What customers owe, in 0-30, 31-60, 61-90 and 90+ days | Standard |
| Ticket performance | Created and completed, turnaround, by status and technician | Standard |
| Commissions | Accrued, earned and paid per person, outstanding payable | Standard |
| Expenses | Operating expenses by category and vendor, recurring and one-off | Standard |
| Budget and actual | Each budget against what was spent | Standard |
| Job costs | By job, vendor and technician; jobs with the lowest margin | Standard |
| Customers | New and returning, top customers, last visit | Standard |
| Busiest hours | Tickets and bills by weekday and hour as a heat map | Standard |
| Tax | Taxable, non-taxable and exempt sales, tax per rate, refunds, tax paid on costs | Standard |
Working with a report
- Dates: presets (Today, This week, Last week, This month, Last month, This year…) or your own range.
- Filters, depending on the report: person, category, status, payment method.
- Basis (where it applies): By issue date (accrual, the default) or By payment date (cash: revenue and tax as received in the period; costs stay on the day they were booked). The cash basis is for the whole company only: a report for one person is always by issue date.
- Compare with the period before: every figure tile shows the earlier value and the change, and charts over time draw the earlier period dashed.
- Figure tiles, a chart and a table. Click a column header to sort; the bottom row adds the columns up.
- Charts: switch line or bars, and ranking or shares where it makes sense (your choice is remembered per report). Click a chip of the legend to hide or show a series.
- Drill down: click a row, a point of the chart, a bar of the ranking, a step of the profit and loss or a cell of the busiest hours to see the records behind it (bills, payments, tickets, expenses, commission entries, refunds, job costs). A row there opens its ticket.
Export and print
- Export → PDF, Excel or CSV. Files keep the order of the table on screen. CSV and Excel hold the rows of the period you chose; the PDF has the figures, the chart and the table, upright up to six columns and landscape above, on the paper size of your invoices.
- Print opens the PDF in the print preview and sends it to the document printer of this computer.
- Exporting needs Export reports, and is part of Standard and Premium.
Who sees what
- See every report opens all reports for the whole company.
- People with only their own reports get the reports that can be limited to one person, locked to themselves.
- Every evening at 9:00 PM the Daily summary is emailed to everyone who may see every report, when email is set up (see Messages).
Ledger Desk calculates with the rates you set up and is not tax-filing software. The Tax report is a starting point for your accountant.
Last updated October 29, 2026